{D3} - Prometheus数据格式及指标类型
Prometheus metrics 概念已被广泛采用,不仅被Prometheus用户采用,还被包括InfluxDB、OpenTSDB、Graphite 和Sysdig Monitor在内的其他监控系统广泛采用。如今,许多CNCF项目使用Prometheus指标格式公开了开箱即用的指标。您还可以在API服务器、etcd、CoreDNS 等核心Kubernetes组件中找到它们。您可以在使用Prometheus的Kubernetes监控指南中了解更多信息。
Prometheus 指标格式被广泛采用,以至于它成为一个独立的项目:OpenMetrics,努力使这种指标格式规范成为行业标准。
在实际应用场景中,当应用程序相互通信时,它们通常以JSON/rpc/xml等格式交换数据。Prometheus在这方面也独具特色,它使用了一个看起来像这样的基于文本的展示格式。在Prometheus监控中,对于采集过来的数据,统一称为metrics数据。metrics数据为时间序列数据,它们按相同的时序,以时间维度来存储连续数据的集合。metrics有自定义的一套数据格式,不管对于日常运维管理或者监控开发来说,了解并对其熟练掌握都是非常必要的。
1.Metrics组成
每个metrics数据都包含几个部分:指标名称、标签和采样数据。
指标名称(metric name):用于描述收集指标的性质,其名称应该具有语义化,可以较直观的表示一个度量的指标。名称格式可包括ASCII字符、数字、下划线和冒号。
标签(label): 时间序列标签为key/value格式,它们给Prometheus数据模型提供了维度,通过标签可以区分不同的实例,
通过标签Prometheus可以在不同维度上对一个或一组数据进行查询处理。标签名称由 ASCII 字符,数字,以及下划线组成, 其中
__开头属于 Prometheus 保留,标签的值可以是任何 Unicode 字符,支持中文。标签可来自被监控的资源,也可由Prometheus通过relabel在抓取期间和之后添加。
采样数据/读数(reading):按照某个时序以时间维度采集的数据,其值包含:
- 一个float64值
- 一个毫秒级的unix时间戳
除了实际采样数据/读数(reading)之外,每个指标都有一个HELP和一个TYPE部分。在TYPE中,您可以看到度量的类型)
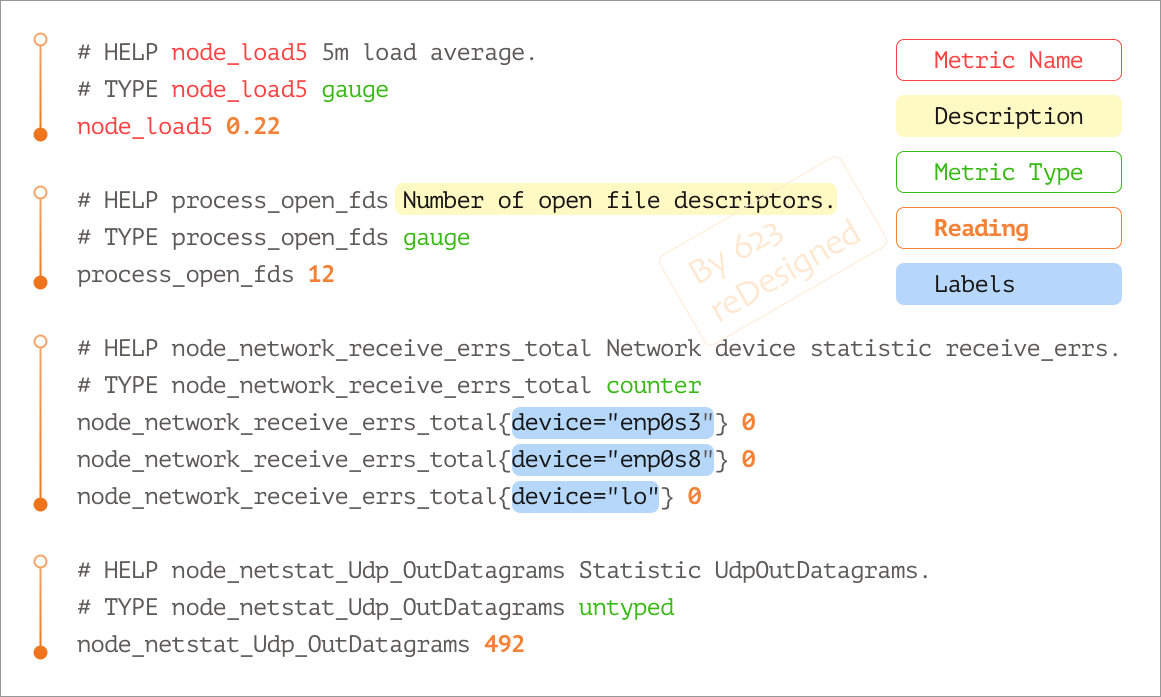 (Metric Sample)
2.Metric类型
Prometheus的时序数据分为Counter(计数器),Gauge(仪表盘),Histogram(直方图),Summary(摘要)四种类型。
- Counter类型
counter类型的指标与计数器一样,会按照某个趋势一直变化(一般是增加),我们往往用它记录服务请求总量、错误总数等。
- 什么时候使用计数器?
* 你想记录一个只会上升的值
* 您希望以后能够查询该值增加的速度(即它的rate)

- 计数器有哪些用例?
* 请求计数
* 完成的任务
* 错误计数
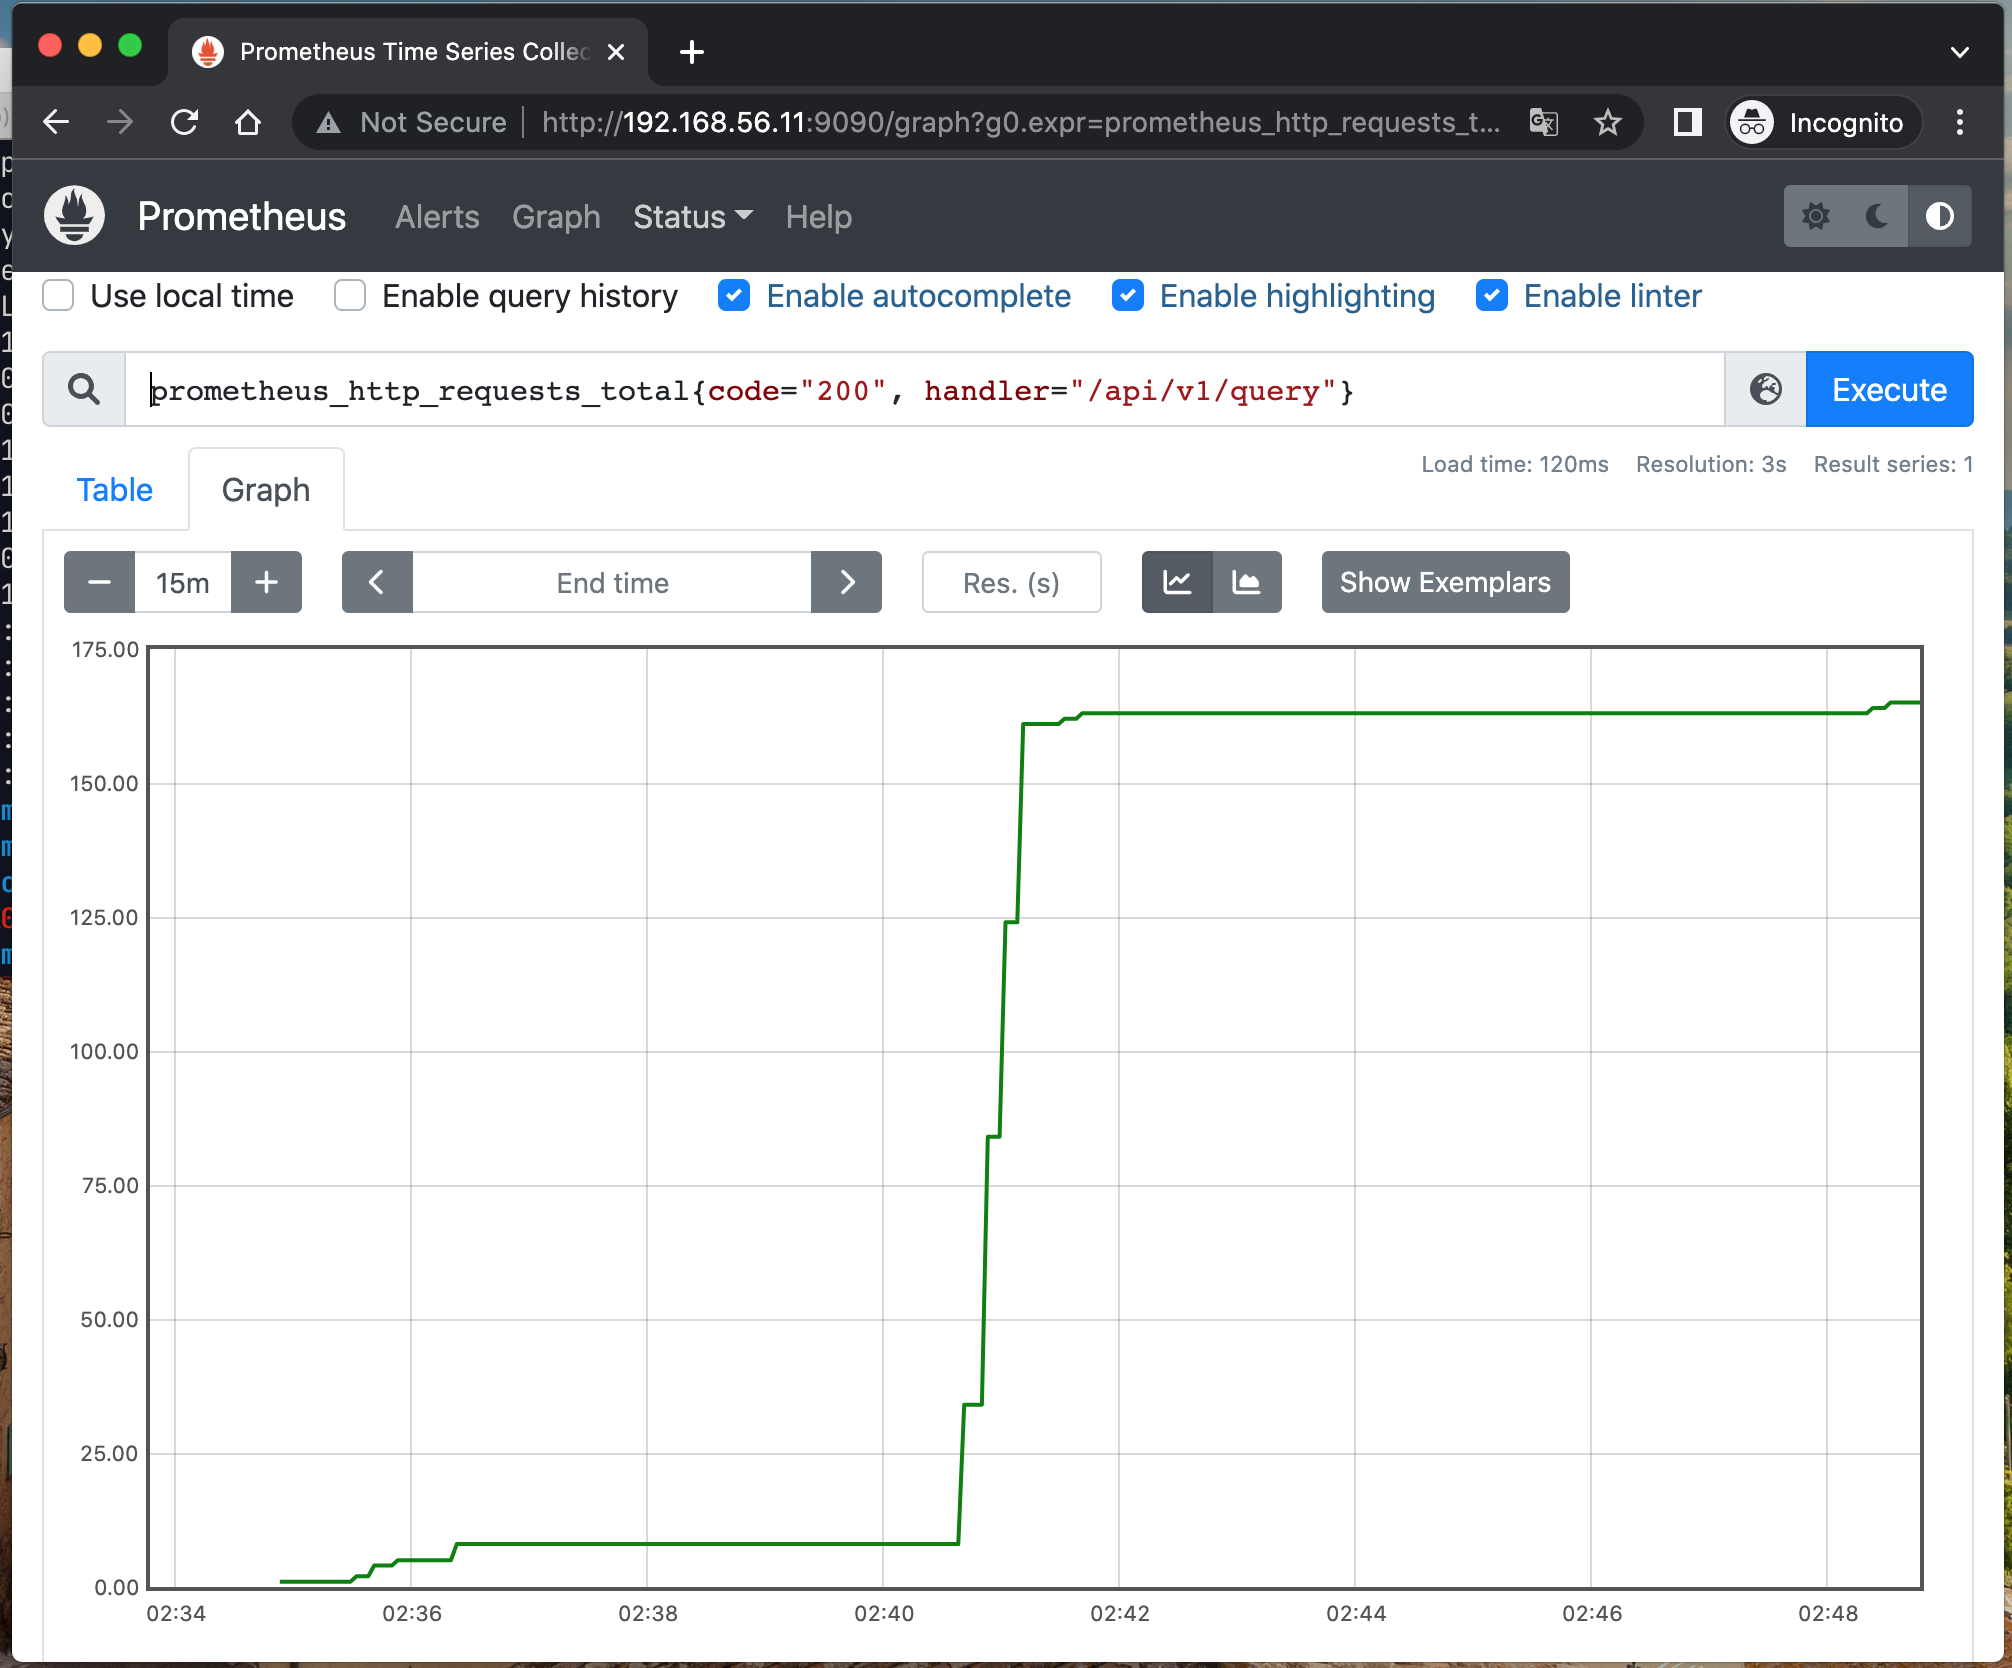
如下图展示就是一个counter类型的metrics数据采集,采集的是Prometheus的接口访问量,可看到数值一直在向上增加。
1prometheus_http_requests_total{code="200", handler="/api/v1/query"}
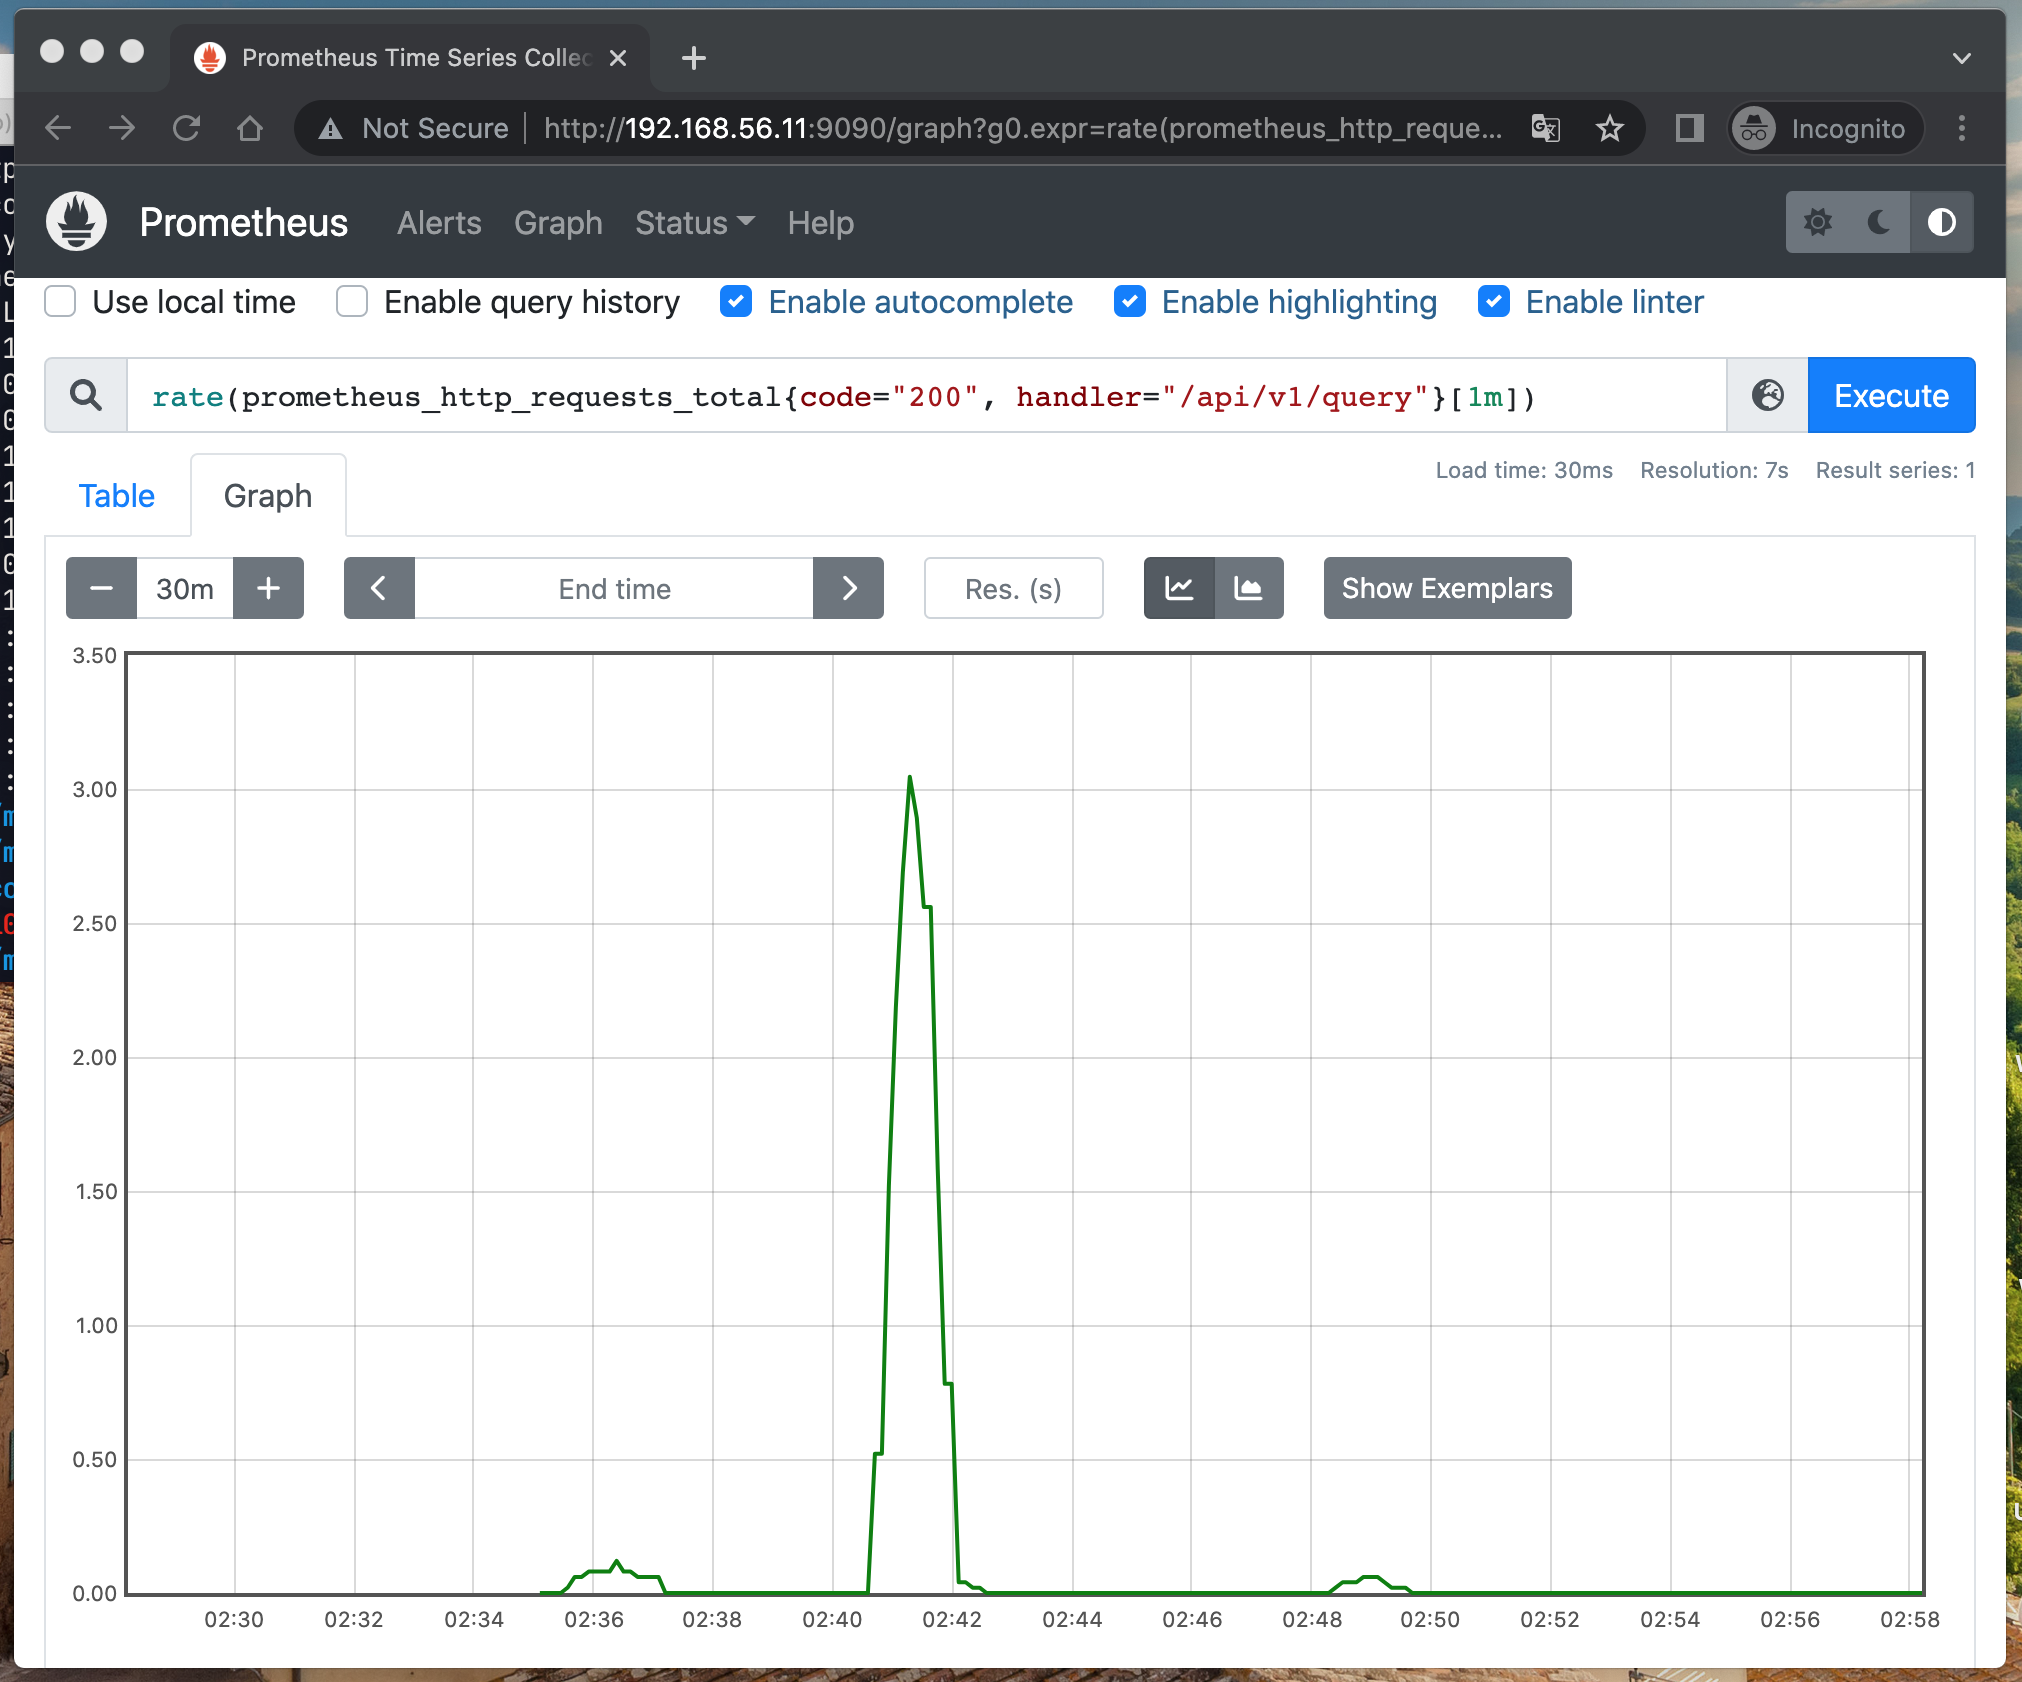
基于counter类型的数据,我们可以清楚某些事件发生的次数,由于数据是以时序的方式进行存储,我们也可以轻松了解该事件产生的速率变化。
例如,通过rate()函数,获取api请求量每分钟的增长率:
1rate(prometheus_http_requests_total{code="200", handler="/api/v1/query"}[1m])
- Gauge类型
与Counter不同,Gauge类型的指标用于展示瞬时的值,与时间没有关系,可增可减。该类型值可用来纪录CPU使用率、内存使用率等参数,用来反映目标在某个时间点的状态。
- 什么时候使用量规?
* 你想记录一个可以上升或下降的值
* 你不需要查询它的比率

- 仪表有哪些用例?
* 内存使用情况
* 队列大小
* 正在进行的请求数
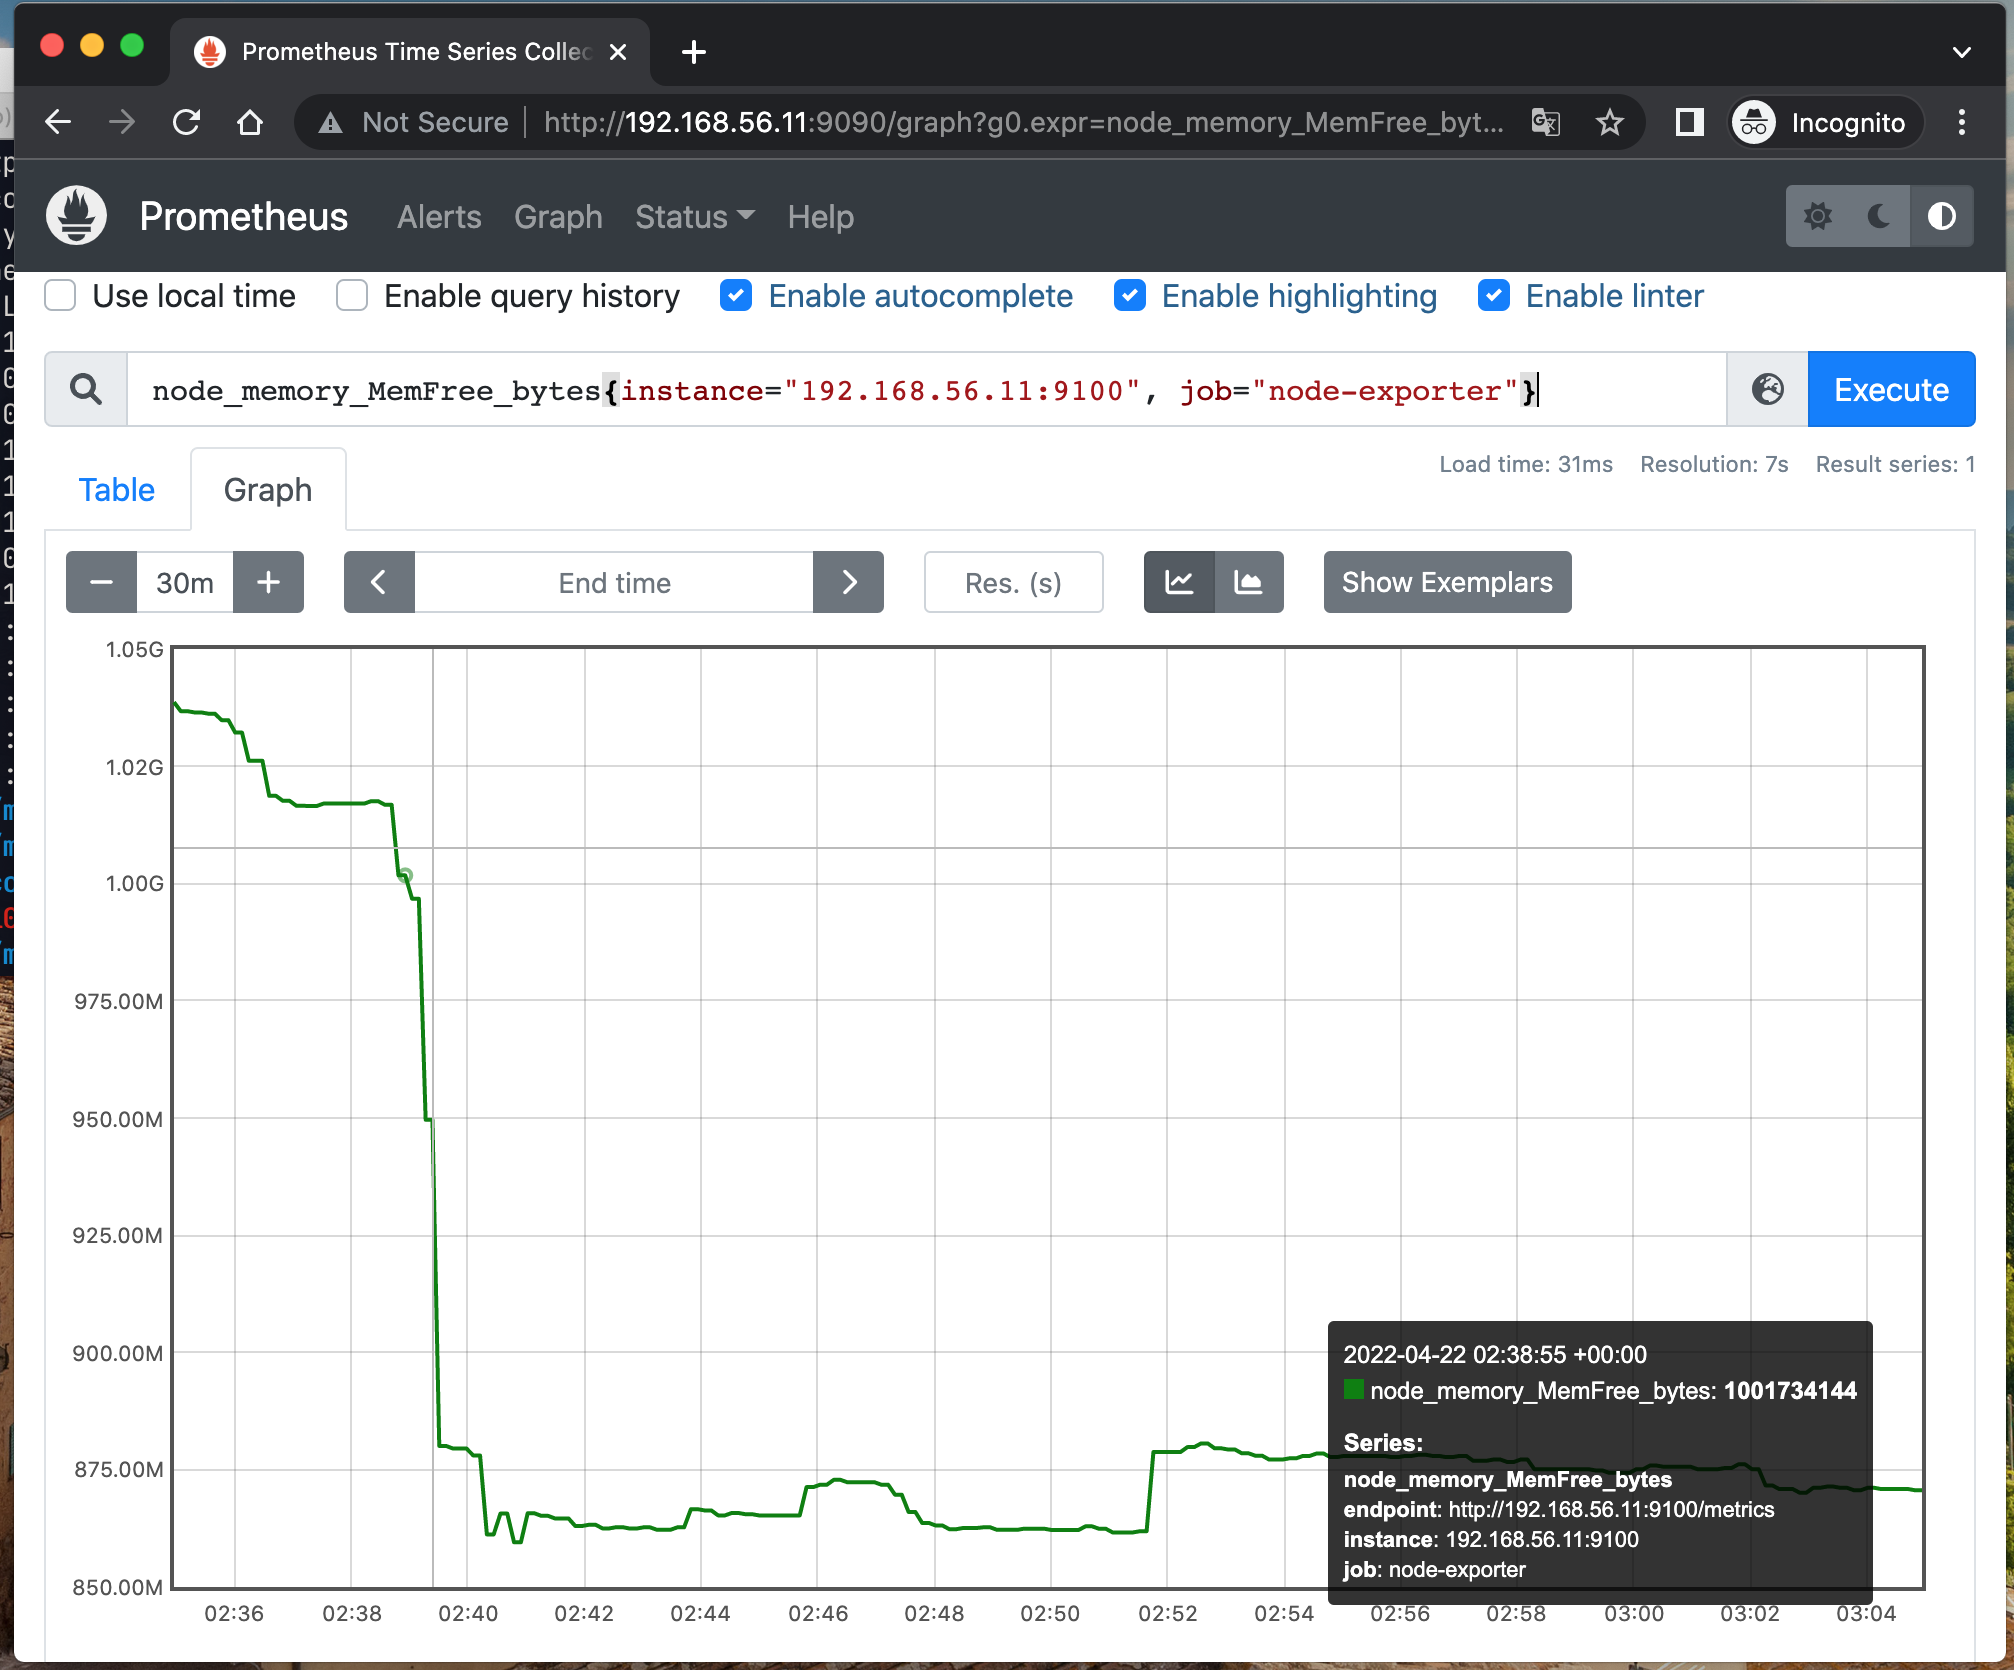
以下是一个关于内存使用量的数据展示,可以看到每个时间点的数据具有随机性,不与其他数据有关联.
1node_memory_MemFree_bytes{instance="192.168.56.11:9100", job="node-exporter"}
2
3
4# HELP node_memory_MemFree_bytes Memory information field MemFree_bytes.
5# TYPE node_memory_MemFree_bytes gauge
6node_memory_MemFree_bytes 8.70629376e+08
- 摘要(Summary)和直方图(Histogram)类型
在大多数情况下,我们可以计算指标某个时间段内的平均值来了解情况,如需要知道每分钟CPU使用率,可通过计算该时间段内采集的数据平均值来获取。
但在某些场景中,这种方式并不合适。假设某个接口一分钟内的请求为1万次,采用平均值的方式计算出响应时间为2s,通过该值我们无法判断是所有请求都不超过2s,还是有部分较高延迟被平均值拉低,该方法缺乏对于全局的观察性。对此,Prometheus通过Summary和Histogram类型来解决这样的问题。
Summary 通过计算分位数(quantile)显示指标结果,可用于统计一段时间内数据采样结果 ,如中位数(quantile=0.5)、9分位数(quantile=0.9)等。
- 何时使用摘要?
* 您想对一个值进行多次测量,以便稍后计算平均值或百分位数
* 您不必担心确切的值,但对近似值感到满意
* 你不知道值的范围是多少,所以不能使用直方图

- 摘要有哪些用例?
* 请求持续时间
* 响应大小
下面是一个Summary类型的指标prometheus_engine_query_duration_seconds,通过该指标我们可以得知,Prometheus进行query操作的数据结果中,50%(quantile=0.5)的耗时小于8.844e-06,90%(quantile=0.9)的耗时小于2.8198e-05。
1# HELP prometheus_engine_query_duration_seconds Query timings
2# TYPE prometheus_engine_query_duration_seconds summary
3prometheus_engine_query_duration_seconds{slice="queue_time",quantile="0.5"} 8.844e-06
4prometheus_engine_query_duration_seconds{slice="queue_time",quantile="0.9"} 2.8198e-05
5prometheus_engine_query_duration_seconds{slice="queue_time",quantile="0.99"} 0.000123539
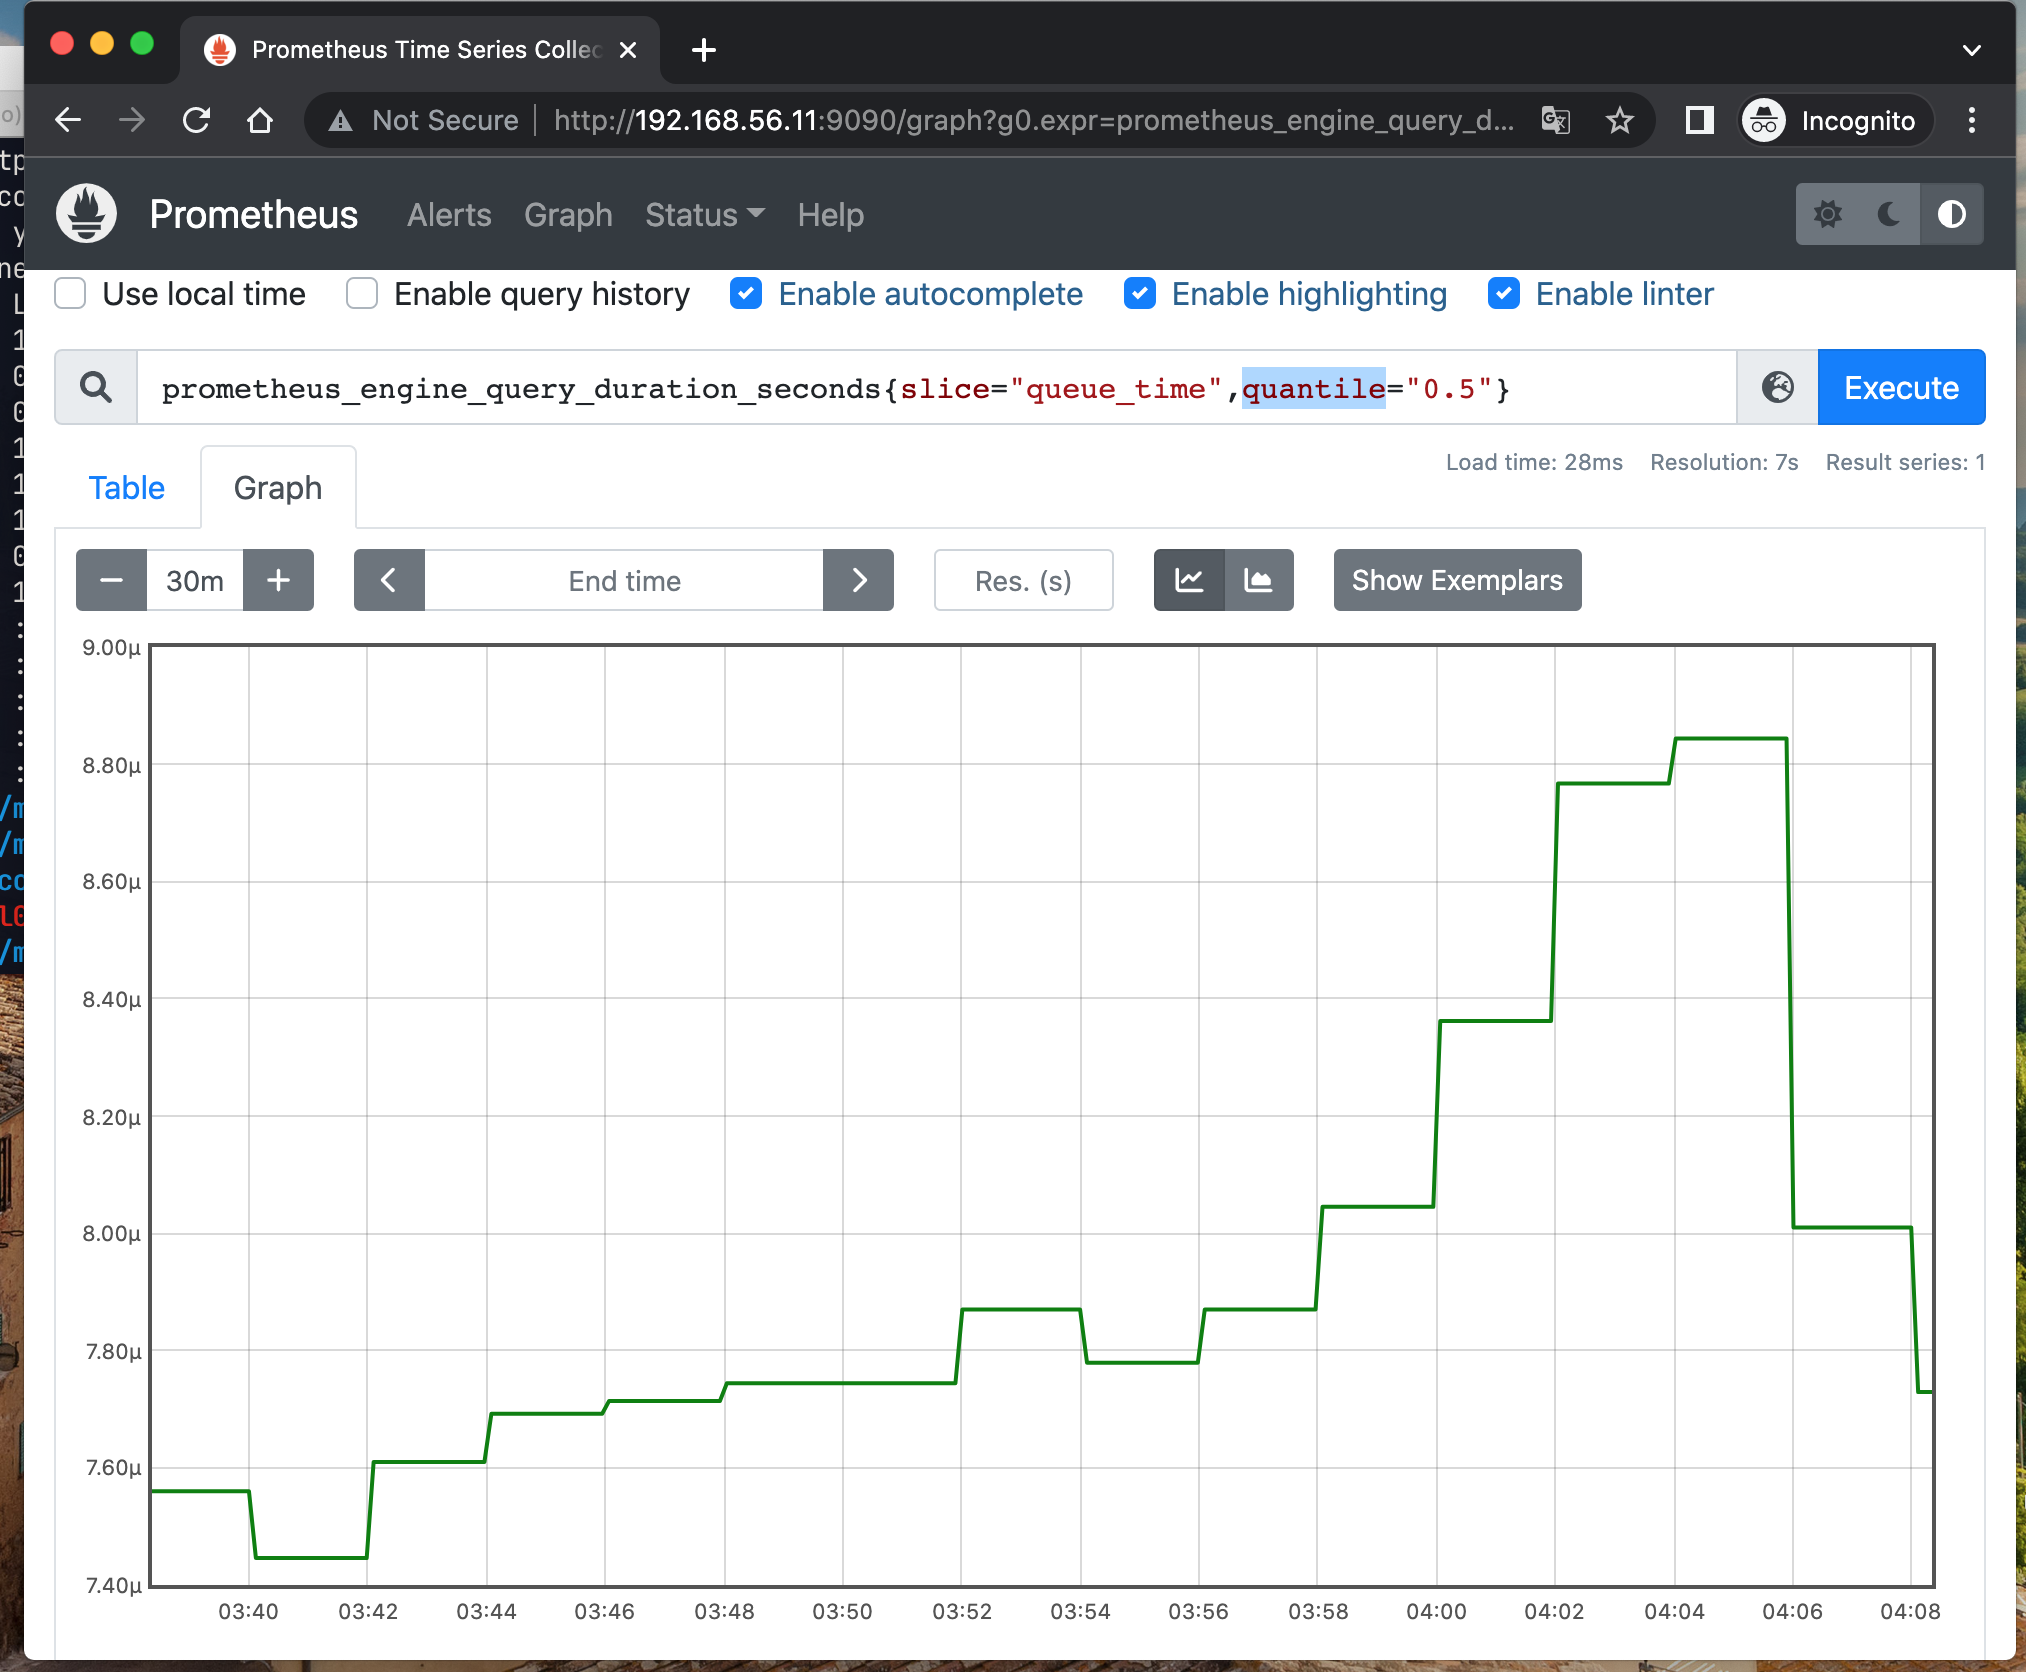
Histogram类型与Summary类型的指标相似之处在于同样会反应当前指标的记录的总数(以_count作为后缀)以及其值的总量(以_sum作为后缀)。不同在于Histogram指标直接反应了在不同区间内样本的个数,区间通过标签len进行定义,通常它采集的数据展示为直方图。
- 何时使用直方图?
* 您想对一个值进行多次测量,以便稍后计算平均值或百分位数
* 您不必担心确切的值,但对近似值感到满意
* 你知道值的范围是多少,所以可以使用默认的存储桶定义或定义你自己的

- 直方图有哪些用例?
* 请求持续时间
* 响应大小
Histogram可用于请求耗时、响应时间等数据的统计,例如,指标prometheus_http_request_duration_seconds_bucket即为Histogram类型。
 1# 样例计算1:
 2  sum(rate(http_request_duration_seconds_bucket{le="0.3"}[5m])) by (job)
 3/
 4  sum(rate(http_request_duration_seconds_count[5m])) by (job)
 5
 6# 样例计算2:
 7histogram_quantile(0.95, sum(rate(http_request_duration_seconds_bucket[5m])) by (le))
 8
 9# 样本数据
10# HELP prometheus_http_request_duration_seconds Histogram of latencies for HTTP requests.
11# TYPE prometheus_http_request_duration_seconds histogram
12prometheus_http_request_duration_seconds_bucket{handler="/",le="0.1"} 1
13prometheus_http_request_duration_seconds_bucket{handler="/",le="0.2"} 1
14prometheus_http_request_duration_seconds_bucket{handler="/",le="0.4"} 1
15prometheus_http_request_duration_seconds_bucket{handler="/",le="1"} 1
16prometheus_http_request_duration_seconds_bucket{handler="/",le="3"} 1
17prometheus_http_request_duration_seconds_bucket{handler="/",le="8"} 1
如果对以上俩者的使用场景还比较模糊,可以参考官方给出的完整的比较区分
3.Exporter运行方式
为了采集目标target的监控样本数据,我们在主机上安装了一个Node Exporter程序或者集成到业务应用服务内部,该程序对外暴露了一个用于获取当前监控样本数据的HTTP访问地址。这样的一个程序称为Exporter,Exporter的实例称为一个Target。Prometheus通过轮询的方式定时从这些Target中获取监控数据样本,并且存储在数据库当中。
- 独立运行
以前面使用过的node_exporter为例,由于操作系统本身并不直接支持Prometheus采集样本数据,因此,只能通过一个独立运行的程序,从操作系统提供的相关接口将系统的状态参数转换为可供Prometheus读取的监控指标。除了操作系统外,如Mysql、kafka、Redis等介质,都是通过这种方式实现的。这类Exporter承担了一个中间代理的角色。
- 应用集成
由于Prometheus项目的新潮,目前有部分开源产品直接在代码层面使用Prometheus的Client Library,提供了在监控上的直接支持,如kubernetes、ETCD等产品。这类产品自身提供对应的metrics接口,Prometheus可通过接口直接获取相关的系统指标数据。这种方式打破了监控的界限,应用程序本身做为一个Exporter提供功能。
4.Prometheus Exporter指标客户端库
Prometheus官方维护4个用Go、Java/Scala、Python和Ruby编写的metric libraries。
Prometheus社区创建了许多第三方库,你也可以使用它们来检测其他语言(或者只是相同语言的替代实现):
- Bash
- C
- C++
- Common Lisp
- Dart
- Elixir
- Erlang
- Haskell
- Lua for Nginx
- Lua for Tarantool
- .NET / C#
- Node.js
- OCaml
- Perl
- PHP
- R
具体详情可以在这里找到.
接下来我们将通过Prometheus提供的指标客户端库来自己实现一个指标(metric)数据暴露功能。首先创建和注册指标(metric)并更新它们的值。Prometheus 汇总处理并数学运算,同时将指标公开给客户端sdk的HTTP 挂载点(endpoint)。这里我们以python sdk来实现exporter的功能。
通过一个简单的样例来说明如何使用客户端sdk来实现metric数据的对外暴露。
 1# -*- coding-8 -*-
 2#
 3# 样例来资源来自于:
 4# https://sysdig.com/blog/prometheus-metrics/
 5#
 6
 7import prometheus_client as prom
 8import random
 9import time
10
11req_summary = prom.Summary('python_my_req_example', 'Time spent processing a request')
12
13
14@req_summary.time()
15def process_request(t):
16   time.sleep(t)
17
18
19if __name__ == '__main__':
20
21   counter = prom.Counter('python_my_counter', 'This is my counter')
22   gauge = prom.Gauge('python_my_gauge', 'This is my gauge')
23   histogram = prom.Histogram('python_my_histogram', 'This is my histogram')
24   summary = prom.Summary('python_my_summary', 'This is my summary')
25   prom.start_http_server(8080)
26
27   while True:
28       counter.inc(random.random())
29       gauge.set(random.random() * 15 - 5)
30       histogram.observe(random.random() * 10)
31       summary.observe(random.random() * 10)
32       process_request(random.random() * 5)
33
34       time.sleep(1)
确认我们的运行的这个http服务是否可以请求成功:
 1$ curl localhost:8080
 2...
 3python_my_req_example_count 0.0
 4python_my_req_example_sum 0.0
 5# HELP python_my_req_example_created Time spent processing a request
 6# TYPE python_my_req_example_created gauge
 7python_my_req_example_created 1.650194544067339e+09
 8# HELP python_my_counter_total This is my counter
 9# TYPE python_my_counter_total counter
10python_my_counter_total 0.5374915785732628
11# HELP python_my_counter_created This is my counter
12# TYPE python_my_counter_created gauge
13python_my_counter_created 1.650194544067849e+09
14# HELP python_my_gauge This is my gauge
15# TYPE python_my_gauge gauge
16python_my_gauge -2.167180853514946
17# HELP python_my_histogram This is my histogram
18# TYPE python_my_histogram histogram
19python_my_histogram_bucket{le="0.005"} 0.0
20python_my_histogram_bucket{le="0.01"} 0.0
21python_my_histogram_bucket{le="0.025"} 0.0
22python_my_histogram_bucket{le="0.05"} 0.0
23python_my_histogram_bucket{le="0.075"} 0.0
24python_my_histogram_bucket{le="0.1"} 0.0
25python_my_histogram_bucket{le="0.25"} 0.0
26python_my_histogram_bucket{le="0.5"} 0.0
27python_my_histogram_bucket{le="0.75"} 0.0
28python_my_histogram_bucket{le="1.0"} 0.0
29python_my_histogram_bucket{le="2.5"} 0.0
30python_my_histogram_bucket{le="5.0"} 0.0
31python_my_histogram_bucket{le="7.5"} 1.0
32python_my_histogram_bucket{le="10.0"} 1.0
33python_my_histogram_bucket{le="+Inf"} 1.0
34python_my_histogram_count 1.0
35python_my_histogram_sum 7.272704486816752
36# HELP python_my_histogram_created This is my histogram
37# TYPE python_my_histogram_created gauge
38python_my_histogram_created 1.650194544068015e+09
39# HELP python_my_summary This is my summary
40# TYPE python_my_summary summary
41python_my_summary_count 1.0
42python_my_summary_sum 1.4793936689007348
43# HELP python_my_summary_created This is my summary
44# TYPE python_my_summary_created gauge
45python_my_summary_created 1.65019454406828e+09
以上是我们自己通过prometheus客户端sdk来实现metric的暴露。当然我们也可是直接用一些开源的现成的第三方exporter实现完成这个事情。这里我们就不再赘述了,具体详见这里。
参考或使用文档:
